The Western Alliance for Greenhouse Action (WAGA) represents seven councils in Melbourne’s west, encompassing the traditional lands of the Wurundjeri Woiwurrung, Bunurong, Wadawurrung and Dja Dja Wurrung people of the Kulin Nation. WAGA acknowledges the traditional custodians of the land on which we work and we pay respect to their Elders, past, present and future.
The WAGA region covers around 3,400 square kilometres, extending from established inner urban areas through new growth suburbs to regional towns and less populated rural areas, with a population of just over 1 million residents (2023-24).
Extensive transformation is underway in the region, with rapid population growth occurring – in the inner developed areas as well as the peri-urban fringe. It is the most culturally and linguistically diverse region in Victoria, with 130 nationalities represented. The area has a low socio-economic demographic with higher than average ill health and unemployment, but there is increasing gentrification of areas of the west, as well as increasing awareness and concern among residents about the effects of climate change.
Industry is also transitioning with an observed decrease in the local manufacturing sector. The region remains an industrial hub, however, for Victoria and indeed Australia in manufacturing, transport, postal and warehouse industries. Each municipality also contains significant retail pockets, the largest being in Maribyrnong and Moonee Valley.
Although the region is particularly vulnerable in areas to the impacts of climate change, there are opportunities to capitalise on the transitions that are occurring and ensure the future sustainability of the region. Each WAGA council is responding to climate change issues within its municipality, but the transitions also present challenges and opportunities for action at a regional scale. WAGA members believe that strong collaboration between stakeholders is necessary to ensure that the region’s communities and businesses thrive in a future global low carbon economy.
Information about the region’s current transitions and particular challenges and opportunities relevant to climate change can be found in the suite of Low Carbon West documents.
Emission trends across the region
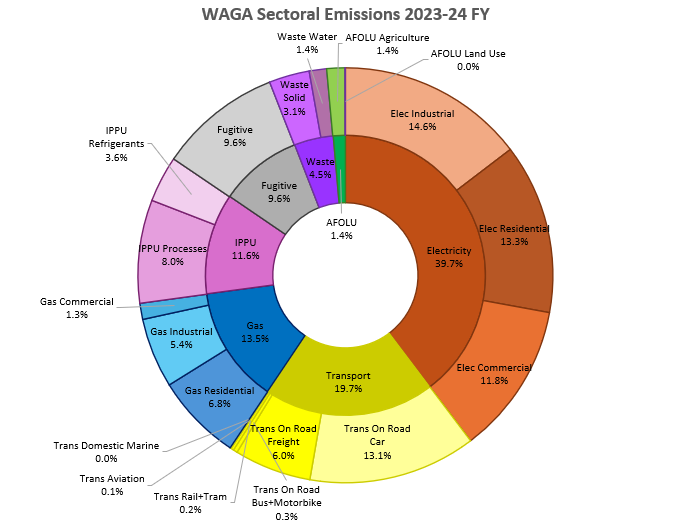
According to the Climate Snapshot Tool, in 2023-24, the WAGA region contributed a total of 10,257,200 tonnes of CO2 emissions.
The largest contributing source of emissions was electricity amongst WAGA councils (4,073,500 tonnes of CO2e, 39.7%) followed by the transport sector (2,020,000 tonnes CO2e, 19.7%), gas (1,382,600 tonnes CO2e, 13.5%) and industrial processes (1,194,000 tonnes CO2e, 11.6%). Fugitive emissions, waste and agriculture (AFOLU) make up the remaining carbon emissions.
The WAGA Councils with the greatest regional share of emissions (above 20%) are:
Brimbank
Wyndham
Hobsons Bay
The council with the lowest share of emissions is:
Moorabool Shire
Data from Snapshot Tool 2024-24FY
Brimbank City Council
Brimbank City Council
Total emissions: 2,771,400 tonnes CO2e
Major emissions source: electricity, with 23.3% of all emissions coming from Industrial manufacturing electricity.
Largest emission driver for this region: Industrial activities in the Brooklyn Industrial Precinct.
Major emissions source: Fugitive emissions make up the largest proportion of emissions at 38.5% alongside Industrial Process IPPU emissions at 20.2%.
Largest emission driver for this region: Fuel importation and distribution activity at the ExxonMobil Altona facility. Several large industrial precincts also add to emissions.
Estimated population: 95,000 residents
Area: Extends across 64 sq kms with a 20km+ coastline.
Major emissions source: On-road car transport dominates the profile with 16.5% of emissions, closely followed by residential electricity at 15.9% and residential gas at 10.1%.
Largest emission driver for this region: Households are driving the top emissions sources after a major transition from manufacturing and industrial based sites to mixed residential/business areas.
Estimated population: 93,000 residents
Area: Extends across 31 sq kms and is only 5-10 kms from Melbourne city centre
Major emissions source: Moorabool is the only WAGA council where farming represents the largest emissions sector, with Agriculture contributing 29.3% of emissions. On road car (18.2%) and residential electricity emissions (16.1%) are also major sources of emissions.
Largest emission driver for this region: Farming of sheep, cattle, dairy cattle and pigs, with residential growth also driving emissions.
Estimated population: 40,000
Area: Extends across 2,111 sq kms with 74% of the Shire comprising water catchments, state forests and parks
Major emissions source: Residential electricity at 15.3% closely followed by industrial process IPPU at 11.3% and on road car emissions at 10.9%.
Largest emission driver for this region: Residential growth is driving emissions. Wyndham also has several industrial precincts including Laverton North logistics hub and Truganina manufacturing centre.
Estimated population: 331,000 residents and has a high annual population growth rate of around 4%.
The Western Alliance for Greenhouse Action (WAGA) respectfully acknowledges and recognises the Woiwurrung, Bunurong, Wadawurrung and Dja Dja Wurrung people of the Kulin Nation as the Traditional Custodians of the land on which we work and we pay respect to their Elders, past, present and future.